Using Data to Guide Instruction and Improve Student Learning
A picture may be worth a thousand words, but in education, information speaks volumes. Data analysis can provide a snapshot of what students know, what they should know, and what can be done to meet their academic needs. With appropriate analysis and interpretation of data, educators can make informed decisions that positively affect student outcomes.

When it comes to improving instruction and learning, it’s not the quantity of the data that counts, but how the information is used.
Research has shown that using data in instructional decisions can lead to improved student performance (Wayman, 2005; Wayman, Cho, & Johnston, 2007; Wohlstetter, Datnow, & Park, 2008). No single assessment can tell educators all they need to know to make well-informed instructional decisions, so researchers stress the use of multiple data sources. Generally, schools collect enormous amounts of data on students’ attendance, behavior, and performance, as well as administrative data and perceptual data from surveys and focus groups. But when it comes to improving instruction and learning, it’s not the quantity of the data that counts, but how the information is used (Hamilton et al., 2009).
SEDL’s Southeast and Texas Comprehensive Centers offer technical assistance and professional development throughout their respective regions to help educators use data effectively. This data-use support includes helping teachers use assessment results and student work samples to identify and address learning difficulties and academic needs. It also has included training on approaches such as Response to Intervention and the Professional Teaching and Learning Cycle to help school staff identify areas for improvement and modify practices.
Louisiana: Professional Learning and Instructional Planning
 During 2009–2010, SEDL staff worked with district and school leaders in St. Helena Parish School System to sustain systematic improvement and ongoing staff development processes. Data analysis was an integral part of this work. St. Helena’s superintendent had requested that technical assistance focus on literacy instruction, and SEDL confirmed that this was the appropriate target area by reviewing student assessment data and observing teacher planning meetings.
The team’s objectives for data use included that all teachers would
- engage in quality professional learning at least weekly to ensure delivery of effective instruction for students, and
- collect student data from several sources—responses on standardized tests, writing samples, and projects—and meet weekly to analyze, interpret, and use the data to adjust instruction and plan lessons.
SEDL staff provided training during which district staff from all content areas learned how to properly implement research-based literacy instructional strategies. In addition, SEDL staff regularly participated in teacher planning meetings and observed classroom instruction to assess the effectiveness of the literacy strategies and provide feedback for improvement.

For the 2010–2011 school year, the district leadership team chose Response to Intervention (RtI) to address students’ diverse needs and foster school improvement. Designed for use in the general classroom, RtI uses graduated levels, or tiers, of support, individualized goals, and frequent monitoring to tackle students’ specific learning and behavioral problems. SEDL staff assisted district and school staff with using student assessment data to designate reading tier placement for each student in the elementary school and all content area placement for high school students. Using 2009–2010 initial, intermediate, and final DIBELS (Dynamic Indicators of Basic Early Literacy Skills) assessment results, district and school leaders and staff set up reading intervention groups, or RtI tier placements, for elementary students. All students will receive Tier 1, or core, instruction. Students scoring “some risk” were placed in Tier 2 and will receive additional targeted instruction to supplement the core instruction. Students scoring “at risk” were placed in Tier 3, where they will receive small-group or one-on-one intensive interventions in addition to core instruction. For high school students, SEDL staff helped district staff use student scores from the Louisiana Graduation Exit Examination to establish RtI tier placement for each content area.
Ongoing data collection and analysis are an important part of RtI, so SEDL staff helped teachers incorporate this process into their weekly planning meetings. “Student work can be an extremely informative type of data,” explains SEDL program associate Robyn Madison-Harris. “A work sample often points directly to a specific academic standard, and teachers can often see where students are struggling to understand a concept.” For example, if a teacher notices that a student successfully writes the beginning sound of a word but does not complete it correctly, the student likely needs instruction in learning letter correspondences for all the letter sounds for the whole word. “Teachers can learn a lot about students’ reading skills and difficulties by analyzing work samples,” explains Kathleen Theodore, a SEDL program associate who provided professional development on literacy instruction in St. Helena Parish.
Texas: Analysis of Data, Instruction, and Interventions
 During 2009–2010, SEDL assisted Lyford Consolidated Independent School District in implementing RtI in its elementary, middle, and high schools. The plan involved two phases: district-wide analysis of data and professional learning sessions. In Phase 1, SEDL staff met with leaders to examine three major categories of data by student groups, grade levels, and campuses:
- Demographic data: student population, participation, attendance, and least restrictive environment for students with disabilities
- Student learning data: Texas Assessment of Knowledge and Skills in reading/ELA (English language arts) and mathematics, adequate yearly progress (AYP) in reading/ELA and mathematics, and beginning- and end-of-year data from the STAR Reading assessment and the Texas Proficiency Reading Inventory
- Disciplinary: office disciplinary referrals, suspensions, and disciplinary alternative education program
Through data analysis, the following trends emerged: (1) The elementary school consistently met AYP; however, staff were concerned that test scores had either plateaued or dropped slightly, particularly reading scores for some grades. (2) The high school had failed to meet AYP in mathematics for 2 consecutive years. (3) An analysis of office referral data and teacher reports helped educators identify students who displayed consistent behavior problems.
Based on this analysis, Lyford’s leadership targeted elementary reading, high school mathematics, and behavior at all grade levels for improvement. They had selected RtI as the intervention strategy for achieving their goals. In Phase 2, SEDL provided district-wide professional development that was designed to increase teacher knowledge of RtI, the use of high-quality instruction and interventions tailored to state content standards, student progress monitoring, and the use of data to make educational decisions. SEDL also provided more targeted training on research-based instructional strategies for reading and mathematics, working with English language learners and students with disabilities, providing positive behavioral supports, and analyzing student work. “Examining student work during staff meetings allowed teachers to gather data to guide common instructional planning and adjustments,” says SEDL program associate Ada Muoneke.
South Carolina: Capacity Building of Teacher Teams
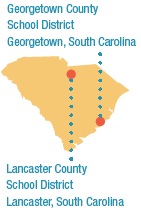
 In South Carolina, SEDL has spent the past year working with two school districts—Georgetown and Lancaster—to strengthen collaborative professional learning and show teacher teams how to analyze student work and data to improve instruction. SEDL staff have used the Professional Teaching and Learning Cycle (PTLC) to structure this work (Cowan, 2009; Tobia, 2007). PTLC is an ongoing, job-embedded professional development approach in which teachers collaborate to plan and implement standards-based lessons. SEDL staff facilitated Georgetown and Lancaster teachers in using this process to examine content standards, develop common assessments to gauge student learning, analyze results from these assessments and others to determine student success, and plan how to refine instruction to scaffold or enrich student understanding.
“In our work with teacher teams, we’ve observed that collaboration centered on building a common understanding of content standards prior to the planning of instruction and assessment has resulted in greater consistency in expectations for student performance,” explains SEDL program associate Dale Lewis. “When teams return to review student work products based on these shared expectations and common understandings, discussion about how to improve future instruction is more focused.” Using interim assessment information to adjust instruction is a central feature of PTLC. Teams analyze data such as student work samples and brainstorm adjustments to instruction to meet both the enrichment needs of high-achieving students and the intervention needs of struggling students (Jacobson, 2010; Tobia, 2007). Recently, SEDL staff facilitated professional learning on analyzing student work samples.
“One student’s sample was particularly troublesome, displaying great difficulty with the writing process,” says Lewis. “The teacher expressed frustration at having tried a variety of approaches and strategies with the student to no avail. The team was able to brainstorm instructional supports that might provide a scaffold to support skill progression and bring the student closer to proficiency. Later that day, the school principal told SEDL staff that the teacher had come to her in excitement a few hours after the team meeting. She had selected a strategy and supports suggested by her teammates and, for the first time, the student had experienced success with the writing task,” says Lewis.
References
- Cowan, D. (2009). Creating a community of professional learners: An inside view. SEDL Letter, 21(1), 20–25.
- Hamilton, L., Halverson, R., Jackson, S., Mandinach, E., Supovitz, J., & Wayman, J. (2009). Using student achievement data to support instructional decision making (NCEE 2009-4067). Washington, DC: National Center for Education Evaluation and Regional Assistance, Institute of Education Sciences, U.S. Department of Education.
- Jacobson, D. (2010). Coherent instructional improvement and PLCs. Is it possible to do both? Phi Delta Kappan, 91(6), 38–45.
- Tobia, E. (2007). The Professional Teaching and Learning Cycle: Implementing a standards-based approach to professional development. SEDL Letter, 19(1), 11–15.
- Wayman, J. C. (2005). Involving teachers in data-driven decision-making: Using computer data systems to support teacher inquiry and reflection. Journal of Education for Students Placed at Risk, 10(3), 295–308.
- Wayman, J. C., Cho, V., & Johnston, M. T. (2007). The data-informed district: A district-wide evaluation of data use in the Natrona County School District. Austin, TX: The University of Texas.
- Wohlstetter, P., Datnow, A., & Park, V. (2008). Creating a system for data-driven decision-making: Applying the principal-agent framework. School Effectiveness and School Improvement, 19(3), 239–259.

Next Article: Research to Practice: What It Means at the Institute of Education Sciences

