Southwestern spending practices mirror national trends
Why does the link between spending and performance matter so much?
- Education spending has grown for the past 40 years, while student performance has not improved by many measures.
- There are still genuine inequities across states, districts, and schools, yet all students are expected to meet high performance expectations.
- Large-scale improvement efforts on the policy agenda in many states—reducing class size, adequately funding programs for the disadvantaged, or improving teacher pay—are costly, and over time the money to pay for them will have to come through reallocation rather than new dollars.
Total education dollars spent is an important basis from which to start any resource allocation study. This, along with an understanding of basic education context, helps to guide education policy decisions appropriate to a locale. SEDL was particularly interested in demographic and expenditure variations across the four states studied. The map on the next page shows some basic context for these states. In 2000, average spending in the four study states ranged from a high of $6,288 per student in Texas to a low of $5,277 in Arkansas. Education spending in the four states was lower than the national average. With the exception of Texas, local districts in the Southwest paid a smaller share of their total dollars than their counterparts in other regions; state and federal funds accounted for more than half of their total revenues. Federal funds are particularly important in SEDL’s region, with every state receiving more than the national average.
We were not surprised to find that the study districts allocate resources along the lines of national averages. About 80% covers student services in schools: instruction, school leadership, counseling services, supplies, and materials. The other 20% is spent on transportation, food services, tax collection, and other business expenses. Instruction alone—that is, teachers, books, and instructional programming— consumes around 60% of available dollars.
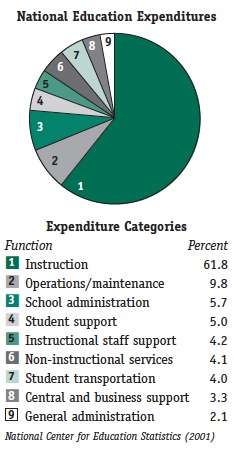 The pie chart of total expenditures helps put the all-important category of instruction into perspective. On average, the national data show spending for operations and maintenance to be just less than 10% of total dollars spent, while general administration weighs in at a mere 2.1% of education expenses.
Performance and spending patterns in southwestern districts
Broad spending patterns in our study resembled the national figures, but we found important differences among school districts when we looked more closely. In all four study states, high-performing districts spent more on instruction than low-performing districts as a share of total expenditures. This is a key finding for policymakers. High-performing districts in three states also spent more on instruction per pupil and employed more teachers. The table on the next page describes characteristics of the high-performing districts in the four states SEDL studied. These findings tell us that where districts put their money is indeed important for student success.
Similar to the findings on investing in instruction, we also discovered that high-performing districts spent more in a category called core expenditures (instruction plus student support and instructional staff support) in two of the states, Arkansas and Louisiana.
Spending strategies in improvement districts
We wanted to take a closer look at the resource allocation practices in school districts with large minority and/or poverty student populations and where student performance is high or on the upswing. At the same time, we wanted to be sure that these districts were reflective of their states in terms of geographic location and size. We selected 12 of these improvement districts and groups of comparison districts from the four study states to include in this part of the study. We surveyed teachers and talked with the improvement district and school leaders about their spending practices and policies to get a richer picture of local practice in light of the expenditure data in our analysis. They told us what works for them and what barriers they face in making decisions about allocating resources.
Staff members are viewed as a resource that can be reallocated to meet priorities.
Core expenditures (instruction, student support, and instructional staff support) increased from 1994 to 1999 in all the districts. The improvement districts were more likely to have increased core spending than their comparison districts, a pattern that was especially evident among the small districts.
We found other characteristics of the improvement districts as well:
- Higher spending on instruction and lower spending on general administration and non-instructional services than their comparison districts
- Disaggregated achievement test data used in budget and curriculum decisions
- Data-driven needs assessments regularly conducted
- Research on instructional programs used to make programmatic decisions
- Increased professional development and technology offered to all staff, especially teachers and other instructional staff
- Pooling of funds, flexibility in spending, and shared budget decisions to better allocate funds
- Needs-based reallocation of staff, including: expanding roles for teachers, redirecting funds to increase instructional staff and decrease central administration, creating new positions, and evaluating and building staff capacity to reassign them to areas of higher need
What is a “resource”? Most of us think first of money when the issue of resource allocation arises. The leaders and staff of our study’s improvement districts employed a broader definition that included the following in their list of resources to be reallocated as needed for improvement goals:
- Personnel
- Time
- Materials
- Parents and community
Staff in the improvement districts did not specifically say that insufficient funding was a major obstacle, but many of the challenges they mentioned would be quite costly. Upgrading the low industry-wide salary levels for teachers and finding adequate time for teachers to get away from class for training and individual planning were common examples. We heard about a wide array of other challenges and barriers associated with resource allocation including:
- Staff shortages and difficulty finding quality teachers
- Enrollment changes and other factors that lead to fluctuating revenues
- Within-district inequities
- Inflexibility of categorical funds
- Large class sizes
The improvement districts put a range of reforms in place to boost the performance of their students and then actively reallocated resources to support those reform efforts. Creative and responsive to school-level needs, these districts used clear goals to allocate funding, staff, time, parent and community, and physical resources.

We also found a pervasive mindset in the improvement districts that staff members are viewed as a resource that can be reallocated to meet priorities. These districts used professional development and time to increase the repertoire of teachers’ skills, thus increasing the pool of teacher “resources” that could be applied to priority areas. The professional development dollars came from a variety of sources, including state budgets.
Some district leaders admitted to having grown hesitant about state mandates since requirements often change and each change involves a new local investment of resources. Mandates requiring new programs or services (e.g., limiting social promotion, increasing benefits for employees, disaggregating data) often arrive without guidance on implementation and without sufficient funding.
District leaders also acknowledged they lack the capacity to investigate, much less track over time, how their use of resources directly affects student performance. Cost-benefit or cost-effectiveness studies could help with this larger picture; better yet, direct evaluations of how spending patterns and practices impact student performance would provide insight. These strategies were not part of the improvement districts’ usual practice, mostly because they have neither the data nor the skills to analyze them.
Next Page: Statewide differences in high- and low-performing district spending