Lesson Plan
| Subject: | Math |
| Grade span: | 3 to 5 |
| Duration: | One week of observation followed by a one-hour lesson |
Description:
This sample lesson is one example of how you can implement the Math Tools practice. In this activity, students will watch the growth of rock candy over a given length of time, describe the varying rate of change they observe, and graph these changes.Learning Goals:
- Recognize patterns and the rules that explain them
- Use mathematics vocabulary to discuss observed growth patterns
- Select and use appropriate tools to make measurements
- Organize and display data in simple charts and graphs
- Observe growth patterns from a table and graph
Materials:
- Graph paper
- Pencils (two per student)
- Ruler (cm)
- One six-inch piece of string per student
- Three cups of granulated sugar per student
- One cup of water per student
- One clean glass jar per student
- Food coloring
- Stove
- Saucepan
- Spoon
Preparation:
- Prior to the activity, make the rock candy solution. Or, you might choose to incorporate cooking into the activity.
- In a medium saucepan, heat two cups of the sugar and the water. Stir until the sugar is completely dissolved. Gradually add a few drops of the food coloring and the additional sugar, stirring continuously until all the sugar is dissolved.
- Designate an area where the rock candy can grow without being disturbed for approximately one week. Students will need access to this area in order to measure growth. Limit movement of the rock candy once it has started growing.
What to Do:
- Using the rock candy solution, set up the growing area for the candy. Pour the solution into a clean glass jar, tie the string to the pencil, and suspend it across the mouth of the jar so that the ends hang into the sugar water. See Rock Candy Diagrams (PDF).
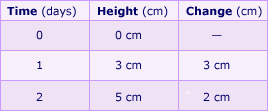
- Have students develop a table containing three columns: Time (days), Height (cm) and Change (cm). They should fill in the initial row with Time 0 and Height 0, leaving the Change blank.
- On day two, give students 10-15 minutes to measure their rock candy growth. The students should remove the string from the water and carefully measure the height of the rock candy. Place this information on the next row of the chart, this time completing the change blank (today's height-yesterday's height).
- Continue charting growth over multiple days until measurable growth has ceased.
- On the final day, have students use graph paper to give visual representation to the candy growth. One axis should be height and the second axis should be time.
- Using this data, have students describe how the rate of growth varied over time. Encourage them to look not only at the height per day, but at what has happened between the recorded heights.
Teaching Tips:
Sample Table for Rock Candy Growth

Change is calculated by subtracting previous day's height from current day's height.
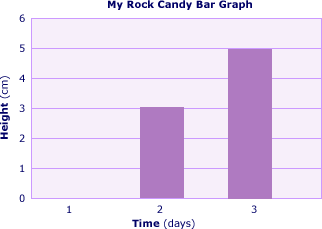
Using graph paper, allow students to use either bar or line graphs to represent the growth pattern of their rock candy. A bar graph illustrating the information above might be illustrated:

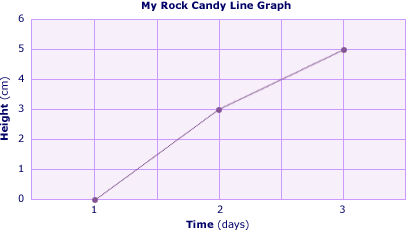
A line graph illustrating the growth of the rock candy:

A printable PDF version of this page is also available. (PDF)
Evaluate (Outcomes to look for):
- Use of vocabulary (such as slow, fast, increase, decrease) to describe what has happened between each measurement taken
- The ability for students to focus not simply on the height measurement but what has happened between the recorded heights
- Comments and answers that indicate that students are listening to, monitoring, and applying the problem-solving strategies of their peers
Standards:
Click this link to see additional learning goals, grade-level benchmarks, and standards covered in this lesson.
