Practice: Tutoring to Enhance Science Skills
Practice in Action
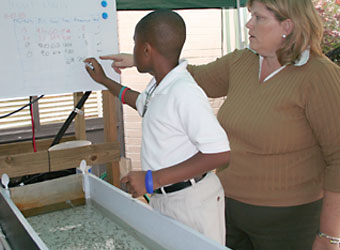
Tutoring to Enhance Science Skills involves helping students master science concepts they are struggling to understand, or targeting specific skills to develop such as observing, predicting, classifying, experimenting, organizing data, or graphing. Science tutoring can take the form of one-on-one instruction or small-group sessions in which students are grouped by skill level and need.
Begin by talking to the school-day teacher to find out what science concepts and skills students are learning, the standards for each grade level, and which students need help. For each student, identify with the school-day teacher specific science concepts or skills that are difficult, and activities that could help clarify a concept and build understanding. Talk to individual students as well, and ask them what science concepts and skills are difficult for them, what their strengths are, and what science activities interest them. Fun, yet challenging activities engage students and increase their desire to learn. For example, reading and discussing real-world problems can help students break down challenging informational text found in science. Creating activities that let students measure and represent data using tables and graphs helps students develop the math skills that are critical to success in science.
The following PDFs may be helpful in organizing and managing your tutoring program:
-
Tutoring Receipt (PDF) records a student's participation in a tutoring activity.
-
Tutoring Log (PDF) can be used to record information about a student's work over time.
If you don't have a science background, make the most of the resources in your community to identify tutors. Contact local high school and college students and teachers, scientists and engineers, health care workers, and retired science teachers. Consider Experience Corps, whose 2,000 members in 19 cities mentor and tutor students in school and afterschool programs.
Tutoring works because the tutor provides relevant, understandable help that is targeted to the individual student's needs and delivers it in a timely manner. Effective tutoring practices include sessions that occur at least three times a week for at least 1.5 hours per week for four weeks or more, close collaboration with classroom teachers, and quality tutor training.
Review the Tips for Tutoring Students in Science (PDF) for more information on using the tutoring lessons in this section.
Planning Your Lesson
Great afterschool lessons start with having a clear intention about who your students are, what they are learning or need to work on, and crafting activities that engage students while supporting their academic growth. Great afterschool lessons also require planning and preparation, as there is a lot of work involved in successfully managing kids, materials, and time.
Below are suggested questions to consider while preparing your afterschool lessons. The questions are grouped into topics that correspond to the Lesson Planning Template. You can print out the template and use it as a worksheet to plan and refine your afterschool lessons, to share lesson ideas with colleagues, or to help in professional development sessions with staff.
Lesson Planning Template (PDF)
Lesson Planning Template (Word document)
Grade Level
What grade level(s) is this lesson geared to?
Duration
How long will it take to complete the lesson? One hour? One and a half hours? Will
it be divided into two or more parts, over a week, or over several weeks?
Learning Goals
What do you want students to learn or be able to do after completing this activity? What skills do you want students to develop or hone? What tasks do they need to accomplish?
Materials Needed
List all of the materials needed that will be needed to complete the activity.
Include materials that each student will need, as well as materials that students
may need to share (such as books or a computer). Also include any materials that students or instructors will need for record keeping or evaluation. Will you need to store materials for future sessions? If so, how will you do this?
Preparation
What do you need to do to prepare for this activity? Will you need to gather
materials? Will the materials need to be sorted for students or will you assign students to be "materials managers"? Are there any books or instructions that you need to read in order to prepare? Do you need a refresher in a content area? Are there questions you need to develop to help students explore or discuss the activity? Are there props that you need to have assembled in advance of the activity? Do you need to enlist another adult to help run the activity?
Think about how you might divide up groups―who works well together? Which students could assist other peers? What roles will you assign to different members of the group so that each student participates?
Now, think about the Practice that you are basing your lesson on. Reread the Practice. Are there ways in which you need to amend your lesson plan to better address the key goal(s) of the Practice? If this is your first time doing the activity, consider doing a "run through" with friends or colleagues to see what works and what you may need to change. Alternatively, you could ask a colleague to read over your lesson plan and give you feedback and suggestions for revisions.
What to Do
Think about the progression of the activity from start to finish. One model that
might be useful—and which was originally developed for science
education—is the 5E's instructional model. Each phrase of the learning
sequence can be described using five words that begin with "E": engage, explore, explain, extend, and evaluate. For more information, see
the 5E's Instructional Model.
Outcomes to Look For
How will you know that students learned what you intended them to learn through this
activity? What will be your signs or benchmarks of learning? What questions might you ask to assess their understanding? What, if any, product will they produce?
Self-Evaluation
After you conduct the activity, take a few minutes to reflect on what took place.
How do you think the lesson went? Are there things that you wish you had done differently? What will you change next time? Would you do this activity again?
Sample Lessons
Students look at data tables and bar graphs showing patterns among different birds at birdfeeders.
Interpreting Data from Birdfeeders (2-5)
Duration: One or two 45-minute sessions
- Understand and interpret data from tables and bar graphs
- Identify parts of a graph and data table including title, independent variable, dependent variable, scale, and X and Y ordered pairs
- Work cooperatively with a tutor
- Interpreting Data from Birdfeeders (PDF)
- Pencils and paper
- Materials to build birdfeeders (if lesson is extended)
- Collect informational books on birds.
- Review the lesson, printouts, and Tips for Tutoring Students in Science (PDF, 60KB).
- Precautions should be taken with tools if making birdfeeders.
- Engage students in the lesson by reading a book together on birds and talking about the different kinds of birds in your area. Ask questions such as: What do birds need to survive? Do you think all birds eat the same thing? How might you find out what different birds eat?
- Explore the data about birdfeeding habits in the data tables and the bar graph that illustrates patterns at birdfeeders. Use the guiding questions to help students make sense of the data tables and bar graph. For example, students should be able to identify what kinds of birdfeed different birds prefer, what the most/least popular kind of birdfeed is, and other patterns.
-
Explain the data. Students should be able to interpret the data based on their answers to the questions.
- Help students understand that an independent variable is something that the person doing the experiment can control or vary—in this case the birdfeed. Likewise, help students understand that a dependent variable is something that the experimentor doesn't control or something that depends on the way the experiment is done—in this case the number of birds that eat each kind of birdfeed.
- Discuss the patterns that students notice, questions they can use to help them interpret data tables and bar graphs, and what they learn from this activity.
- Extend learning if time allows by building birdfeeders or conducting a bird field study. Design an investigation to identify and count the number of birds in your area. Then display the data in data tables and in a bar graph.
-
Evaluate (Outcomes to Look For)
- Student participation and engagement
- Questions and answers that reflect an understanding of the data
- Answers that reflect an understanding of how data can be represented in tables and bar graphs
- An understanding of independent and dependent variables, and how they are represented on X and Y axes
Learn more about the 5Es.
Students take the results, or data, from different experiments and learn to make data tables.
Note: This is the second lesson in a series. Start with Interpreting Data from Birdfeeders.
Learning to Make Data Tables (3-10)
Duration: Two 45-minute sessions
- Understand data as pieces of information
- Learn how data can be represented in a table
- Construct a data table from experiment results
- Interpret data from a data table
- Notebook paper
- Pencils
- Clear ruler
- Graphing paper (optional)
- Large chart paper for K-2 students (optional)
- Connect with the school-day teacher to review students' needs.
- Review the lesson, printouts, and Tips for Tutoring Students in Science (PDF, 60KB).
- Print all of the PDFs for this lesson. If you are working with more than one student, make copies as needed.
- There are no safety precautions for this lesson. However, if simple experiments are conducted in expanding this lesson, follow appropriate safety precautions such as using goggles or safety spectacles.
-
Engage students by identifying what they already know about displaying data.
- Begin by reviewing data as pieces of collected information. Typically, data represents something that can be observed and measured, from how often it rained in the last week to how much chlorine is in local pools.
- Ask students to show you a sample of a data table or graph they have made. This may be a crumpled sheet of paper with numbers clustered randomly, representing something they have observed and measured.
- Review the Sample Data for Data Tables (PDF) and ask students to make a data table from one of the examples. Note what students understand and where they need to modify their thinking.
-
Explore data tables. Review the Guidelines for Making a Data Table (PDF) and the Checklist for a Data Table (PDF).
- Ask students to select an example from the sample data and create a data table.
- As students work, review any vocabulary associated with data representations. Watch for typical errors and help students learn to identify them, check their work, and correct errors independently.
- Explain the results. Ask students to explain how they organized the data in their data tables. Review students' data tables using the data table checklist. If you feel that sufficient progress has been made, ask students to continue with other sample data sets.
- Extend learning if you have extra time. Use school-day science lessons or the Internet to collect additional data for more data tables. If you are familiar with Microsoft Excel®, teach students to create electronic data tables.
-
Evaluate (Outcomes to Look For)
- Student participation and engagement
- Answers that reflect an understanding of what data is, and that it represents pieces of information
- Answers that reflect an understanding of how data can be organized in a table (use the data table checklist)
Learn more about the 5Es.
Students take the results, or data, from different experiments and learn to make bar graphs.
Note: This is the third lesson in a series. Start with Interpreting Data from Bird Feeders, then complete Learning to Make Data Tables.
Learning to Make Bar Graphs (3-10)
Duration: Two 45-minute sessions
- Learn how data can be represented in a bar graph
- Construct a bar graph from experiment results
- Interpret data from a bar graph
- Notebook paper
- Pencil
- Clear ruler
- Graphing paper (optional)
- Large chart paper (optional)
- Connect with the school-day teacher to review students' needs.
- Review the lesson, printouts, and Tips for Tutoring Students in Science (PDF).
- Print all of the PDFs for this lesson. If you are working with more than one student, make copies as needed.
- There are no safety precautions for this lesson. However, if simple experiments are conducted in expanding this lesson, follow appropriate safety precautions such as using goggles or safety spectacles.
- Engage students by asking them what they already know about bar graphs, or asking them to show you a sample of any bar graphs they have made. Or, review the Sample Data for a Bar Graph (PDF) or the data table they made in the previous lesson (Learning to Make Data Tables). Select one data set and ask students how they might represent the results in a bar graph. Note what students understand and where they need to modify their thinking.
-
Explore bar graphs.
- Review the Guidelines for Making a Bar Graph (PDF) and the Checklist for a Bar Graph (PDF). Ask students to select an example from the sample data and create a bar graph.
- As students work, review any vocabulary associated with data representations. Watch for typical errors and help students learn to identify them, check their work, and correct errors independently.
- Explain the results. Ask students to explain how they organized the data in their bar graphs. Review students' bar graphs using the bar graph checklist. If you feel that sufficient progress has been made, ask students to continue using other sample data sets to create additional bar graphs.
- Extend learning if you have extra time. Ask students for ideas, or use school-day science lessons or the Internet to collect additional data for more bar graphs.
-
Evaluate (Outcomes to Look For)
- Student participation and engagement
- Answers that reflect an understanding of how data can be organized in a bar graph (use the bar graph checklist).
- Understanding of x axis, y axis, and variables
Learn more about the 5Es.
Students take the results, or data, from different experiments and learn to make line graphs.
Note: This is the last lesson in a series. Start with Interpreting Data from Birdfeeders, then Learning to Make Data Tables. You may want to review Learning to Make Bar Graphs if you feel it would help students understand line graphs.
Learning to Make Line Graphs (5-10)
Duration: Two 45-minute sessions
- Analyze data from a data table
- Construct a line graph to represent data
- Understand line graphs and interpret data using line graphs
- Notebook paper
- Pencil
- Clear ruler
- Graphing paper (1 cm x 1 cm preferred)
- Connect with the school-day teacher to review students' needs.
- Review the lesson, printouts, and Tips for Tutoring Students in Science (PDF).
- Print all of the PDFs for this lesson. If you are working with more than one student, make copies as needed.
- There are no safety precautions for this lesson. However, if simple experiments are conducted in expanding this lesson, follow appropriate safety precautions such as using goggles or safety spectacles.
- Engage students by asking them what they already know about line graphs, or asking them to show you a sample of any line graphs they have made. Or, review the Sample Data for a Line Graph (PDF) or the data table they made in the previous lesson (Learning to Make Data Tables). Select one data set and ask students how they might represent the results in a line graph. Note what students understand and where they need to modify their thinking.
-
Explore line graphs.
- Review the Guidelines for Making a Line Graph (PDF) and the Checklist for a Line Graph (PDF). Ask students to select an example from the sample data and create a line graph.
- As students work, review any vocabulary associated with data representations. Watch for typical errors and help students learn to identify them, check their work, and correct errors independently.
- Explain the results. Ask students to explain how they organized the data in their line graphs. Review students' line graphs using the line graph checklist. If you feel that sufficient progress has been made, ask students to continue using other sample data sets to create additional line graphs.
- Extend learning if you have extra time. Ask students for ideas, or use school-day science lessons or the Internet to collect additional data for more line graphs. If you are familiar with Microsoft Excel®, teach students to create electronic spreadsheets with line graphs.
-
Evaluate (Outcomes to Look For)
- Student participation and engagement
- Answers that reflect an understanding of how data can be organized in a line graph (use the line graph checklist)
- Understanding of x axis, y axis, and variables
- Understanding of how to interpret data from a line graph
Learn more about the 5Es.
Resources
Explore these resources to assist in implementing the Tutoring to Enhance Science Skills practice in your program.
Resources for Sample Lessons associated with this practice:http://www.nature.net/birds/
Cornell Lab of Ornithology and the American Ornithologists' Union, The Birds of North America
http://bna.birds.cornell.edu/BNA/
http://www.birds.cornell.edu/programs/
Teaching Kids About Birds
http://www.wildbirds.com/
Learning to Make Data Tables
Cothron, J.H., R.N. Giese, and R.J. Rezba. Students and Research, 3rd Edition. Dubuque, IA: Kendall/Hunt Publishing Co., 2000.
Learning to Make Bar Graphs
American Association for the Advancement of Science, Science NetLinks, What Is a Graph?
http://www.sciencenetlinks.com/Lessons.cfm?DocID=37
Annenberg/CPB Learner.org, Getting the Picture: Communicating Data Visually
http://www.learner.org/exhibits/dailymath/getpicture.html
Directions for Making Scientific Graphs Using Excel
http://www.ncsu.edu/labwrite/res/gt/gt-menu.html
National Center for Educational Statistics, Create a Graph
http://nces.ed.gov/nceskids/graphing/
Print Resources:
Cothron, J.H., R.N. Giese, and R.J. Rezba. Students and Research, 3rd Edition. Dubuque, IA: Kendall/Hunt Publishing Co., 2000.
Learning to Make Line Graphs
American Association for the Advancement of Science, Science NetLinks, What Is a Graph?
http://www.sciencenetlinks.com/Lessons.cfm?DocID_=37
Annenberg/CPB—Getting the Picture: Communicating Data Visually
http://www.learner.org/exhibits/dailymath/getpicture.html
Directions for Making Scientific Graphs Using Excel
http://www.ncsu.edu/labwrite/res/gt/gt-menu.html
National Center for Educational Statistics, Create a Graph
http://nces.ed.gov/nceskids/graphing
North Carolina State University, LabWrite Resources, Graphing Resources
http://www.ncsu.edu/labwrite/res/gh/gh-linegraph.html
North Carolina State University, LabWrite Resources, Graphing with Excel (for high school students)
http://www.ncsu.edu/labwrite/res/gt/gt-menu.html
Print Resources:
Cothron, J.H., R.N. Giese, and R.J. Rezba. Students and Research, 3rd Edition. Dubuque, IA: Kendall/Hunt Publishing Co., 2000.